Has this tournament been exciting or what?! I’m writing this at the halftime of the England and Denmark semi final. Starting tomorrow Make Better Bets, the story where I bet the World Cup with an Excel model, will be available for free! I’d love to hear your thoughts and an Amazon review would be more than appreciated!
Updated Strategy
We were placing the bets last night and discovered some of our bets’ odds have shifted out of our favor:

Also we couldn’t find the place top 2 bets. We downsized some of our big boys (Netherlands, Italy, and Spain) winning their groups for search of greener pastures. We did see that we thought the individual game of Italy vs Turkey seemed cheap and we have decided to put $200 on Italy today. We had them winning about 80% ( would theoretically pay -400) of the time and we are paying I think south of -200. We’ve also elected to keep $875 in cash on the side to utilize throughout the tournament in possible hedge scenarios, or random YOLO scenarios. Happy watching and go Azzuri!
Euro 2020/21 is Approaching!
I wanted to make a post to show the picks before kickoff but will try to go more in depth with the improvements (at least I hope) to the modeling. If you want to read the analysis, which spurred a bunch of the new improvements, that can be found here: Amazon.com: Make Better Bets: An Actuary’s Quest to Bet the Russian 2018 FIFA World Cup with Excel eBook: Allweil, Jack: Kindle Store
I have some general takeaways after looking at the model results vs the odds:
- Seems like a lot of money is going into England and Belgium. England gets most of their games at home but beware that sweet 16 matchup!
- Germany seems to be undervalued, maybe being too harshly punished for their early exit in the 2018 World Cup
- Seems to be some good odds for exiting later in the tournament for some of the big boys

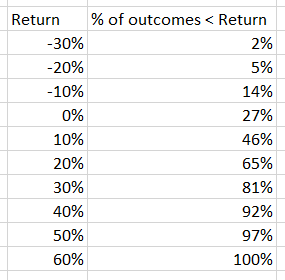
Above you can see the betting allocation for the analyzed 216 bets. And below you can see the distribution from our analysis, still about a 30% chance of losing money:

Make Better Bets Free for Next Two Days!
This is the story of how I made an Excel model to bet the 2018 World Cup, with lessons learned and European travel stories sprinkled in. Please enjoy and any feedback or reviews would be greatly appreciated.
Revamped Book Cover and Free for the Weekend!

Get the E-book for free! Here’s the synopsis:
This is an actuary gone rogue story. Actuaries assess all kinds of risk and in this case it’s in the realm of sports betting. This is a look at how anyone can methodically setup a program to imitate and model future states of the world in a probabilistic manner. The world is not just win-lose-tie, black or white, up or down, but more of a sliding scale or spectrum of results. Learn to think in probabilities and use that information to make better decisions. This is a dive into getting fired and being scared to developing a sports model in Microsoft Excel and using that model to bet thousands of dollars on the 2018 World Cup in Russia, with no regrets.
Free Ebook on Amazon!
My book about how I bet thousands of dollars on the 2018 World Cup is available for free, but only for the next week!
The book is out on Amazon!
The book is now available on Kindle at:
FIFA Changed their Methodology again…
The stats that I used last time are essentially dead to me. It’s time to adapt or die. I will use the slightly altered FIFA rankings from the European qualifying campaigns and I’m finally going to try and collect salary data. Salary data is tough to get for some of these lower teams so I’m most likely going to have to do some hard core estimating. If anyone would like to help me collect I will pay.
How to Make Sense of it All
Here’s a small excerpt from The Bet is Round:
I was first going to try to replicate what Syzmanski and Kuper did for Soccernomics. I was going to see if I could figure out a regression model using country statistics including GDP/capita, population, and international appearances by country to predict goal differential. They found that those three factors contributed about 25% of the predicted goal differential. While I was on a search to account for more than 25% of the predicted goal differential it was a great place to start. I had some ideas that had been touched upon in their books. The salaries of the players was an interesting variable but the thought of having to go through each game and figure out how much money the team’s total salary, average salary, or median salary seemed daunting. Can you imagine having to go through and find the salaries of all the players for Ethiopia or Singapore that played in each of their games? In retrospect I probably didn’t look hard enough for that information as there’s probably some database somewhere that has all that information. I also had a slightly more qualitative idea at the time wanting to look at percentage of the starters playing in one of the big four leagues, including the English Premier League, the Italian Serie A, the German Bundesliga, and La Liga which is the Spanish league. My thought was the more players you had playing in, what most considered, the best leagues the better your country’s team probably was.
Kuper and Syzmanski were on a mission to figure out which countries utilize their resources most effectively. So which countries had a consistently better goal differential than what was predicted by the regression model looking at those three factors. As I said earlier they found certain countries used their resources quite well (Brazil, Iceland, Croatia…) while others underperformed (China, India, etc…). The thought behind those factors were as follows: 1) As a country gets wealthier they’ll have more surplus to spend and invest in soccer development. Or at least not being in extreme poverty, or a civil war, would be beneficial to your country’s soccer success. 2) The more people you have in a country there’d be more soccer players to choose from and thus the team would be better (so China…). 3) The more exposure a country has to foreign competition, and foreign tactics, on the international stage the better as the country can learn from better teams. Fun fact, once again, the country with the most international games is Sweden!
I think, as many have also observed, soccer ideologies are converging as countries get more exposure to other successful countries. Think of all the players going to fine tune their trade now in Europe and how that affects their country of origin. Take the Dutchmen Johan Cruyff, the three-time Ballon D’Or winner, as an example. He is associated with the ideology known as Total Football. The idea of Total Football is one of fast moving, dynamically flowing players moving in sync without real limitations in where any one player should be and positions being more of a formality. If one person leaves his general area to attack a teammate fills in. Unlike many great players Cruyff was also a great coach and manager. After his playing career he took the Dutch Total Football to Barcelona as a coach. He has been widely credited with turning that club around. He was focused on the importance of maintaining possession of the ball throughout the game. If our team has the ball the whole time it’s very hard for the opposition to score. This sounds simple enough. Some would argue it was this mentality that morphed into tiki taka football which has been used by Messi’s Barcelona for much of the last decade as well as being a large component to the Spanish National Team which found World Cup euphoria in South Africa in 2010 against, who else but, the Dutch. This tika taka football is at times unpleasant to watch as the players pass a ton and move but often don’t take chances and go forward which can become unpleasant to a neutral spectator. The Spaniards also won European Championships in 2008 against Germany and 2012 against Italy. There was about a 5-year window where, for what it’s worth, I say that Barcelona team was the best club team I’ve seen and that Spanish team was the best country team I’ve ever seen.
What are in the FIFA Rankings?
In the 2014 Brazil World Cup , as many before it, the first pot consisted of the host country and the other top 7 teams in the world by FIFA ranking. Pots 2 thru 4 were then formed by region trying to explicitly accomplish geographic diversification from the onset, with small exceptions such as the lowest team in Europe getting sent to the African bucket in 2014, oddly enough being France. This format oftentimes led to lopsided groups, albeit geographically diverse, and a group or two that really stood out as very tough. This often, and by often I mean like every time, led to a group being dubbed, “The Group of Death.” The USA had the task of being in the group of death in 2014 with the historical American kryptonite in Ghana, Cristiano Ronaldo’s Portugal, and eventual champions Germany.
What is FIFA’s job after all? They strive for their product to be competitive and try to put on entertaining matchups. Their job is to produce compelling matchups and one would think they want, and I would agree with, great teams playing at the very end in FIFA competitions. Would they want 3 teams in the world top 15 to be playing each other in the group stage of the World Cup? While it would make for compelling matchups early on, and while maybe satisfying geographic diversification, it would not allow all three great teams to get out of the group stage. That would have certainly been a Group of Death. They must have faith that the FIFA rankings, albeit being slightly biased towards their own rankings, would be a good indicator of how the games will go. In the new format, seen in the most recent version in Russia, you’d never see three top 15 ranked teams in the same group. This would, on a cursory level, appear to be fairer and smooth the playing field from group to group. I could get behind this. The goal was to improve the balance of the groups and I believe it accomplished that.
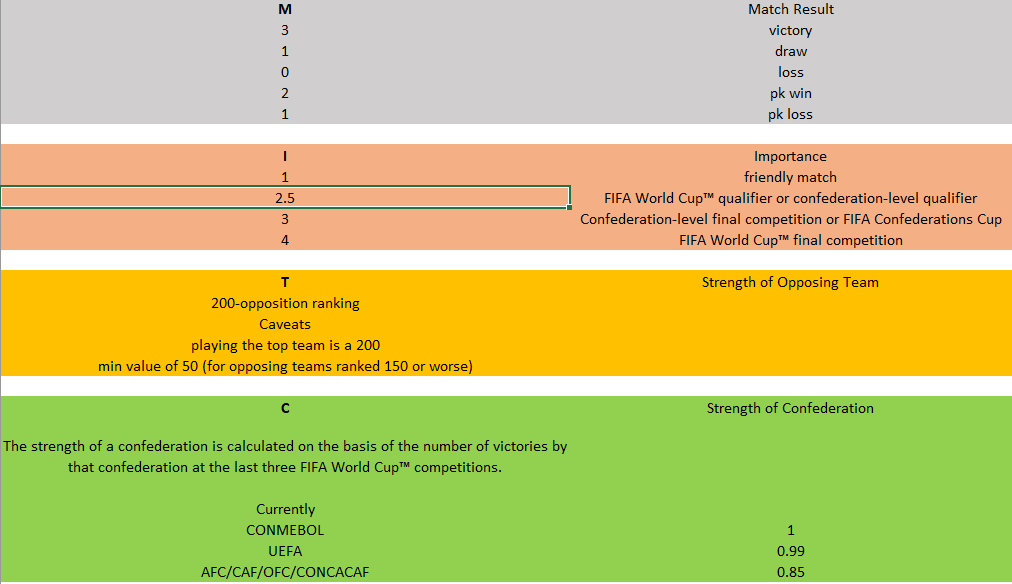
How are the FIFA rankings currently determined? Simply put it’s a point system. Teams acquire points from results. FIFA ranks the points of countries from greatest to least and then you get the FIFA rankings. Points can be calculated from the equation, P=M*I*T*C, where:

Going into the 2018 World Cup the M, I, T, and C were defined as :
The points from the last four years are then weighted to produce what is commonly referred to as a weighted moving average. Those weights follow the table below:

As a quick example let’s say a country has:
200 points this year
150 points in the prior year
100 for the year three years ago
250 for the year four years ago
1*200 + .5*150 + .3*100 + .2*250 = 355 points
Let’s swap the prior year’s points with the points from four years ago in the prior example to see how the resulting points change. Below, one can see that more recent success is rewarded in this framework. Success four years ago, while taken into consideration, is not as heavily rewarded as more recent success.
1*200 + .5*250 +.3*100 + .2*150 = 385 points
Prior to 06 the FIFA rankings were based off an average of the last 8 years of games with different weightings for the current scheme, different types of matches, the opponent’s ranking, which conference the opponent came from, and how far back in time the game was played. For example, a win against Vanuatu in a friendly match was not worth the same points as beating Spain in the World Cup. After the Germany 06 World Cup this was slightly altered by only looking at the last 4 years of games, thus only including one World Cup cycle instead of two World Cup cycles. A FIFA ranking of 17 in 2003 was fundamentally different than looking at a FIFA ranking of 17 in 2018.
In the FIFA ranking system teams get points for friendlies, albeit a quarter of the points that would be received compared to a World Cup game ( 1 in a friendly vs 4 in a world cup) but points nonetheless. As there are points on the line and the points determine the seeding for qualifying campaigns teams are incentivized to meticulously schedule somewhat easier opponents in hopes of getting better seeding. Some countries really try to challenge themselves against better opposition during friendlies but certain teams really try to navigate the system to their advantage.
Like I mentioned before beating opponents in different conferences also has different weightings. Beating a European or South American team is better for getting points than beating a team in Asia all else being equal (seen in the variable C in the variable table above). And since meaningful intercontinental play between World Cups is rare it doesn’t give much chance for teams in the “weaker” conferences to advance. Since UEFA and CONMEBOL have greater weights we often see clumps of European and South American teams in the top 10-20. They have better weightings because those conferences have tended to perform better in World Cups. If the 2018 semi-finals happened to be composed of Mexico, Iran, Egypt, and Senegal it’d be a safe bet that those conference weightings would change.
While it’s been discussed, and appears quite likely, to change the FIFA ranking system and while I do agree with a lot of the changes I, quite selfishly, don’t want them to as this means me having to acquire even more data going forward as I would have to come up with a method to convert these “old” FIFA rankings into the corresponding new method ranking. I’ll save that challenge for when it’s confirmed. The next iteration will most likely involve some new ranking and hopefully it doesn’t penalize teams for taking friendlies against better opponents.
If you like this type of material please sign up with your email and I’ll send you a free pdf of the Bet is Round.
